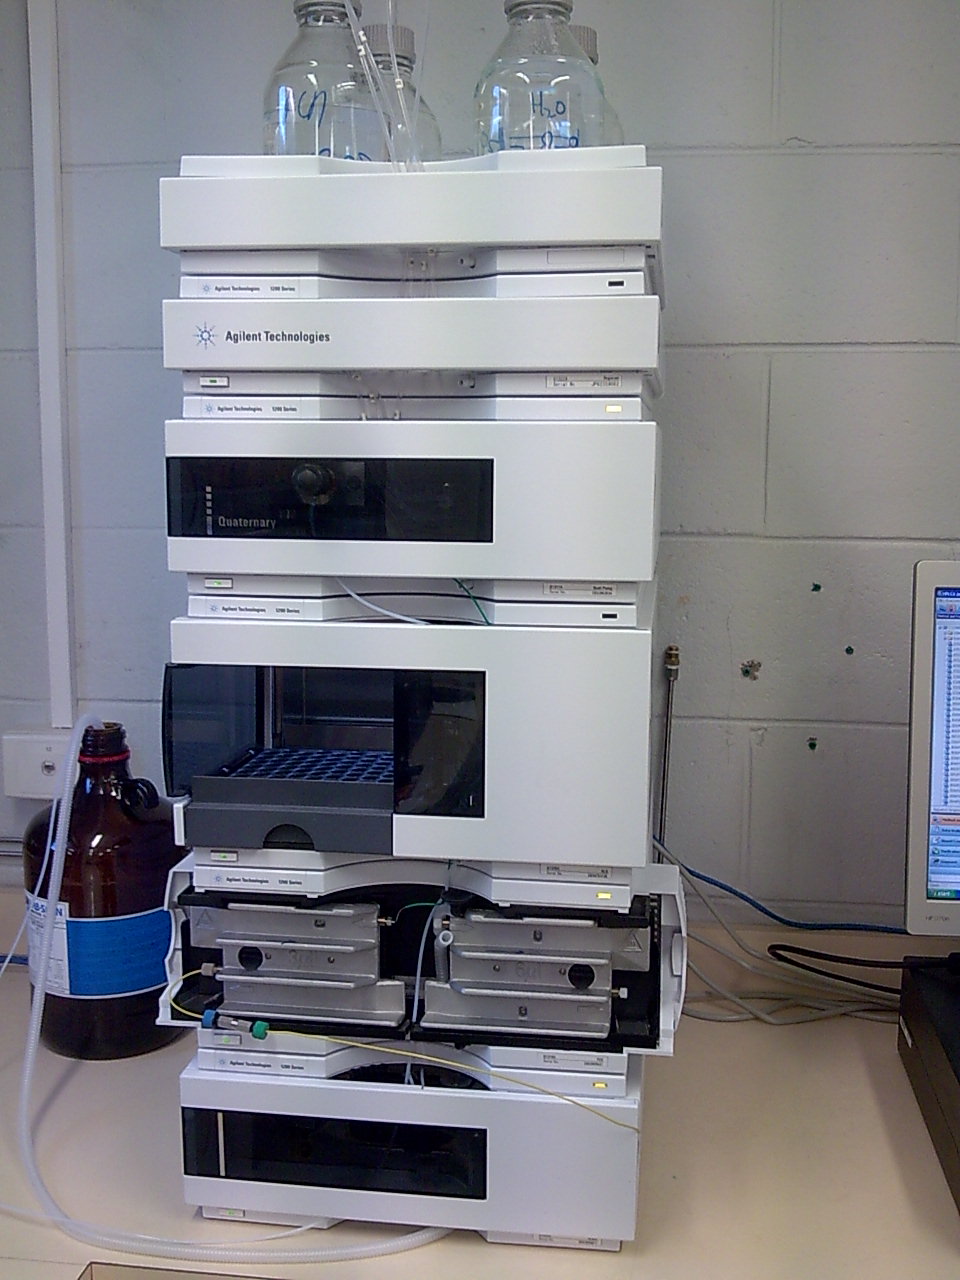
 One of the more important aspects of peptides that are used for scientific study on animal test subjects involves the process of determining the effectiveness of the materials involved in conducting the research. Specifically, it is imperative that the purity of the peptides involved is scrutinized, especially in terms of long-term research projects. If a peptide is at or close to 100% in its purity level, the end results of the research will be consistent. If a peptide does not approach these high numbers of purity, a higher rate of variability can be introduced into the research phase, thus causing a potential disruption to the integrity of the studies being conducted.
There are a few techniques that have been crafted in order to determine the overall purity of a research peptide before it is put to use. One of the more prominent techniques is a method that is known as HPLC, or high performance liquid chromatography.
Chromatography at a Glance
HPLC utilizes a technique called chromatography in order to measure the purity of a peptide. In essence, this procedure functions to separate various components in a mixture. While there are generally two ways in which chromatography can be primarily executed – gas chromatography and liquid chromatography – HPLC utilizes the latter technique in order to study a peptide’s purity.
The method in which this is carried out is part of two phases:
- Mobile Phase – This is the phase in which a peptide sample is broken down via an appropriate solvent.
- Stationary Phase – This is where the different components of a peptide are isolated and graphed based on their level of solubility as it passes over a stationary solid sorbent, such as silica or polymers.
The level of purity that is marked largely depends on how the peptide reacts as it passes through the stationary phase after it has been suitably prepared for such action coming out of the mobile phase. A peptide that is 100% in its purity will essentially have one peak of consequence on the chart, along with other smaller peaks that are more or less non-affective regarding the peptide’s purity levels. A peptide that ends up with a lower purity percentage are given such a metric because it presents a significant number of compounds or contaminates that are located within the research peptide.